In a world where humanity must rebuild from the ashes, games may seem like a trivial pursuit. Yet, in the aftermath of the apocalypse, our mission at the Applied Digital Anthropology (ADA) department of the New Age government is anything but trivial. Tasked with restoring the essence of human civilization, we’ve turned to an unexpected cornerstone of human experience: games.
Our team is exploring how machines can simulate human cognition and strategies to help shape the future of this planet. Why games? Because they encapsulate problem-solving, strategic thinking, and creativity — traits essential for humanity’s survival and progress. To this end, we’ve embarked on a case study of Wikispeedia, a game that challenges players to navigate Wikipedia’s web of articles from one topic to another using only hyperlinks. Simple, yet deeply revealing of how humans connect concepts, prioritize paths, and think under constraints.
Meet the Team

Dr. A. E.
Our lead researcher, a brilliant mind in the field of artificial intelligence and human cognition.

Dr. T. K.
Our resident expert in game theory and human psychology.

Dr. G. T.
Our data scientist, who wrangles the vast amounts of data we collect from Wikispeedia.

Dr. P. M.
Our game designer, who crafts the challenges that players face in Wikispeedia.

Dr. L. P.
Our anthropologist, who studies the social dynamics of Wikispeedia players.
Together, we form ADAspeedia, a team united in exploring how machines can emulate and evolve human behavior. To see the real faces of our team, click here. You can also view our real functions in the readme.
Our research question is: How do LLMs compare to humans when playing the game of Wikispeedia regarding their strategy, results, and the semantic distances elicited from the Wikispeedia measure of relatedness?
Table of Contents
- Introduction
- Meet the Team
- A Human Blueprint
- Building our machine
- The digital mind’s capabilities: A comparative analysis
- Side research: other models?
- Shared strategies
- A question of perspective
- The machine’s understanding of the human language
- In summary
A Human Blueprint
A descriptive analysis of the human Wikispeedia dataset
To recreate human-like behavior, we first need to understand how humans played Wikispeedia. What strategies did they use? Did they wander aimlessly or systematically? How did they balance the exploration of diverse topics with the focused goal of reaching their destination? These questions guided our initial analysis of the human dataset, revealing the intricacies of the paths taken, the cognitive shortcuts employed, and the common hurdles encountered.
For this, we have data extracted from the Previous Age. A team of researchers from EPFL has collected thousands of paths taken by humans, unified in a single dataset.
We’ve analyzed it to keep only the essential features useful for our research.
Articles
This is the data containing the name and data contained in each article. In total we have access to 4604 different articles.
Links
This is the list of outgoing links from a given source article.
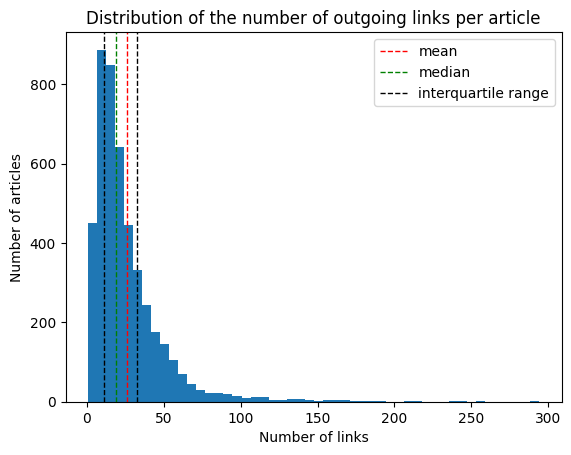 On average, articles have around 26 outgoing links, the median being at 19. Half the articles have between 11 and 33 outgoing links. The United States article has the most outgoing links (294), and each article has at least 1 outgoing link. The distribution of the number of links per article is right-skewed. We show the number of outgoing links and its distribution because they play a crucial role in how we can evaluate the relatedness between two articles, as any metrics should be inversely weighted by the PageRank value of the article. Pagerank is an algorithm that gives a weight to each node of a graph based on how often a surfer would land on it by traversing the graph at random.
We can also look at this data the other way around: based on the articles at our disposal, how many incoming links are there per articles? This can give us an idea of how reachable articles are.
On average, articles have around 26 outgoing links, the median being at 19. Half the articles have between 11 and 33 outgoing links. The United States article has the most outgoing links (294), and each article has at least 1 outgoing link. The distribution of the number of links per article is right-skewed. We show the number of outgoing links and its distribution because they play a crucial role in how we can evaluate the relatedness between two articles, as any metrics should be inversely weighted by the PageRank value of the article. Pagerank is an algorithm that gives a weight to each node of a graph based on how often a surfer would land on it by traversing the graph at random.
We can also look at this data the other way around: based on the articles at our disposal, how many incoming links are there per articles? This can give us an idea of how reachable articles are.
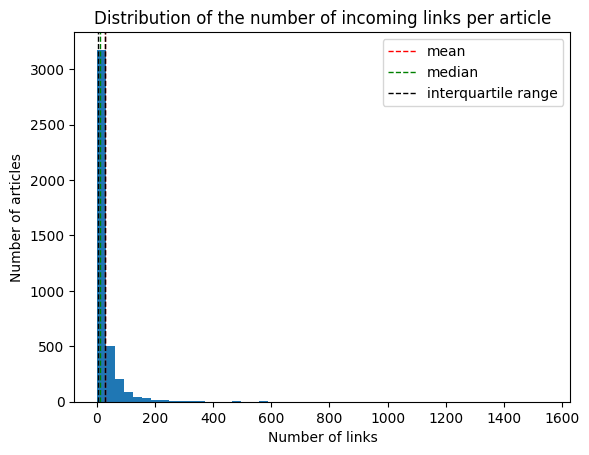 We can note that articles are always reachable within our given set. The median number of incoming links is of 10, while the mean is of 29 incoming links. Some severe outliers, such as the United States article again with 1551 incoming links, skew the distribution to the right.
Explore how articles are linked together!
Categories
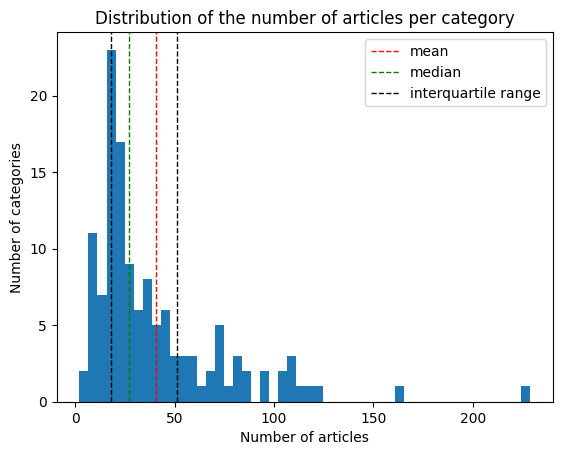
These refer to the classification of each article based on high level concepts they are each related to. In total, 129 categories are available in our dataset. 88% of articles are linked to one single category, around 11% have two and less than 1% have 3. This reveal different level of granularity and lack of coherence in the dataset. For example, ‘United_States’ is linked to Countries and North American Geography. ‘Great_Britain’, on the other hand, is linked to ‘British History’ and ‘Politics and government’, but no ‘European Geography’.
On average categories have 40 articles. If we now look at the distribution of the categories, we see it is not spread evenly. We will consider the categories to understand the differences between the human and the LLM semantic distances, so it is important to see if there is a disparity in the representation of each category.
Paths
The paths are sequences of articles visited by players (id & title of the articles separated by a comma). They can be subdivided in the success paths (Paths finished) and the failure ones (Paths unfinished). In total we have access to 28718 finished paths and 24875 unfinished ones.
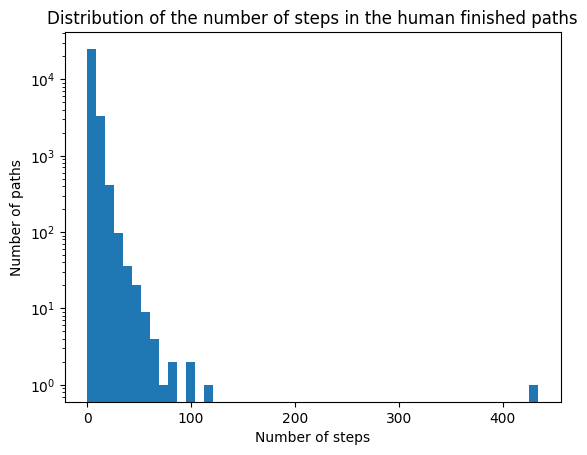
Paths finished
On average humans take 6 steps to get to the goal. A few outliers are present, such as the path with the maximum number of steps (434) to go from ‘United_States’ to ‘English_language’, or the second to first, taking 118 steps to go from Napoleon_I_of_France to Recycling.
Another info we have are the ratings: These are user submitted grades between 1 and 5 representing the level of difficulty felt on the given path. This information is optional, hence we have less values to base our description on (approx. 55%).
Our two indicators of difficulty are the path length and the ratings. The latter being a user-centered metric, based on subjective feelings, while the former is more objective, focusing on performance. An interesting thing to look at is to check if a correlation might exist between the two.
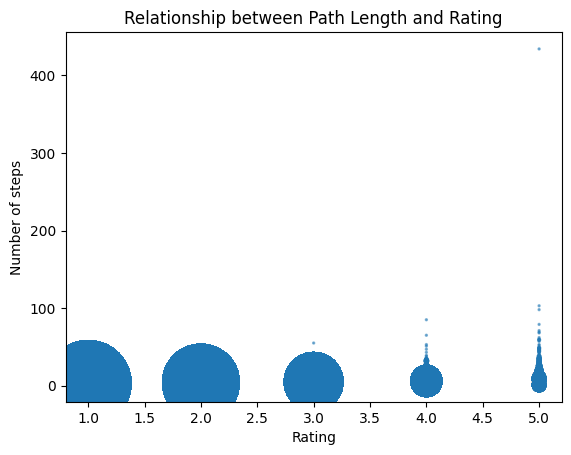
Obviously a positive correlation appears visually, but this is also due to outliers in the data. If we remove them, by taking only the path lengths under the 80th percentile (13), we get the following plot:
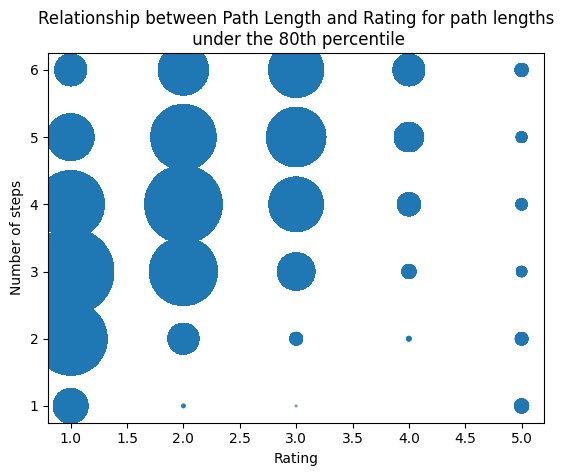 When computing the Spearman R correlation coefficient, we find a positive correlation of 0.46 with a p-value at 0.0. This clearly shows that in our dataset, path length and ratings are positively correlated.
Paths unfinished
Within the 24875 unfinished paths, there is actually only 18190 unique ones, the other being duplicate attempts at the same source-goal pair of articles.
We found 4200 pairs of source-goal articles in common with the finished paths. We wanted to dig deeper and look at potential difficulty markers.
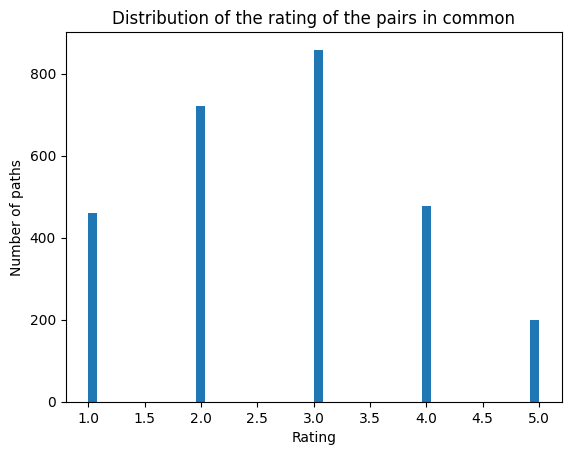 Here we don’t see any positive correlation. Hence we can’t definitely relate ratings given by users to the difficulty of unfinished paths.
Players can forfeit their attempt in two different ways: either by timing out after 30 minutes of inactivity, or by restarting manually. There is overall 64.5% of restarts and 35.5% of timeouts.
Building our machine
Protocol for data collection
To ensure our AI models are as reliable as possible while minimizing computation time, we have chosen the GPT-4o mini model from 2024, which is still operational today in one of the decommissioned datacenters we have repurposed. At the time, it was the most efficient and cost-effective model, making it ideal for this type of task.
We will later compare it to another model, MistralAI Large-2407, also from 2024, which we have run using our emulators.
Our analysis will be conducted in two distinct ways: with and without memory for the LLM. Initially, we will run an LLM without memory on a unique subset of human paths. There are 28,718 such paths, meaning our first LLM without memory will generate 28,718 paths based on the following prompt:
model: “gpt-4o-mini”
You are navigating Wikipedia from start_article to end_article.
Currently at current_article.
Available links: join(linked_articles).
Which article would you like to visit next? Respond only with the article name.
To avoid loops (which can easily occur when the LLM lacks memory), we deliberately choose to halt exploration whenever a loop is detected. The complete code is available here.
The digital mind’s capabilities: A comparative analysis
Do LLMs find shorter paths than humans on average and how do they compare to humans overall?
A good first indicator of our machine’s capabilities is to look at the lengths of the paths completed.
As a reminder, we’ve already seen previously that human paths are on average 6 steps long, with a maximum of 434.
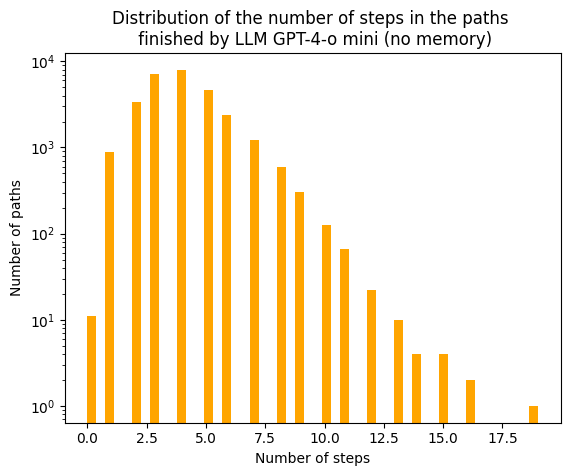 The median for the paths created by the LLM without memory is of 3 steps with a maximum of 16. Clearly, LLMs tend to complete paths faster than humans, showing that the machine is playing better than humans. However, as previously stated outliers are present within the human dataset. This may hinder our ability to truly visualize how both distributions are. To correct that, we suggest looking at the value up to the 99th percentile.
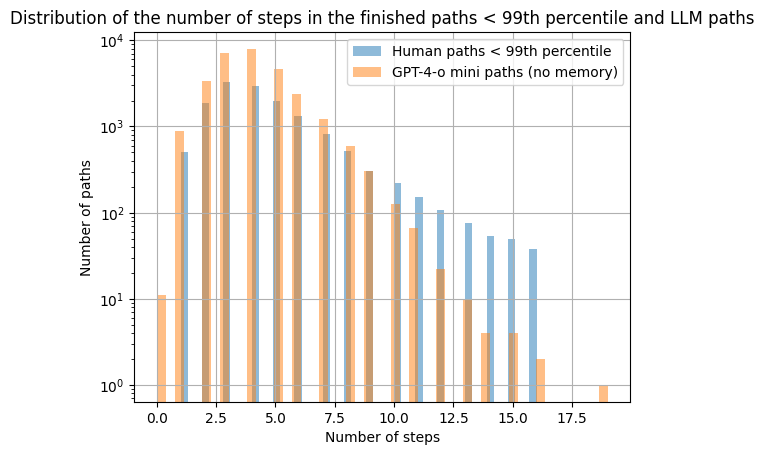
Over here, we can see more clearly how much both distributions are different. The human paths are spreading more towards the right, i.e. they are longer in general. We can look at specific examples. United_States -> Abraham_Lincoln. A human mind might first think about Abraham Lincoln being President of the United States, and hence take the path United_States -> President_of_the_United_States -> Abraham_Lincoln. Our machine abstracts these unnecessary connections and “sees” that Abraham_Lincoln is directly reachable from United_States. As a first indicator, this shows that our machine is able to think more efficiently than humans. It is able to link two notions together in smaller steps, displaying great skills at this game.
Now, we’re interested to see if the machine can succeed where humans fail. We therefore took the paths where humans previously failed, i.e. unique pairs of start and goal articles that have never been finished by humans. We ran our machine on these 1396 paths. Overall we get the following distribution of outcomes.
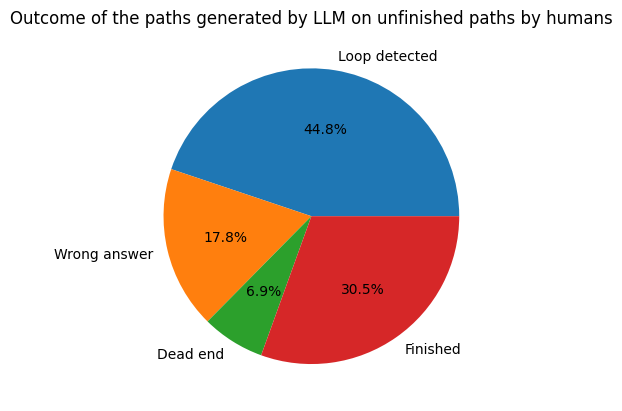
“Wrong answer” refers to the machine trying to access a link that is not part of the ones available at a given step, “Dead end” refers to arriving at an article with no outgoing links and “Loop detected” means that the machine is stuck in a loop. Here, the machine has been able to finish 30% of paths that humans were previously unable to complete. This shows our machine’s superiority against the human race. To go even further, we decided to look at the distribution of the lengths on these new completed paths.
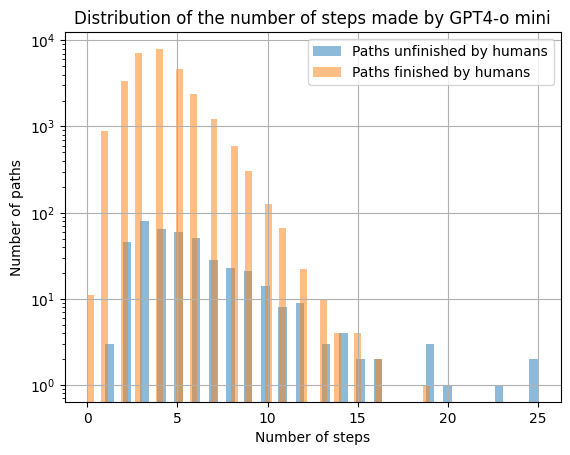
We clearly see that overall, our machine takes more steps on these paths than on the previous ones, with a median of 5 steps. This shows that these paths requires more refined thinking, which can explain why humans failed.
As previously mentioned, humans usually adopt a strategy of getting away then homing in, passing through hubs. Let’s see if the most visited articles are similar.
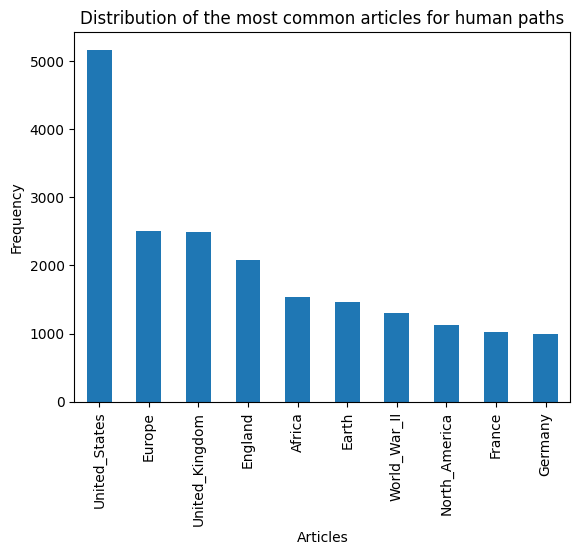
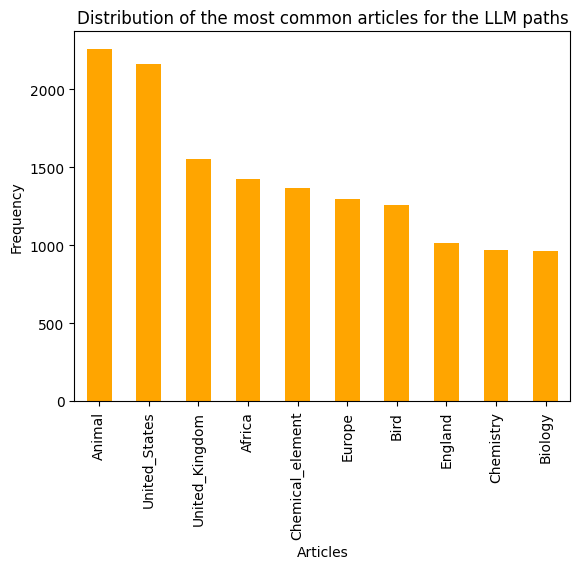
Humans seem to focus on various geographical locations more. In contrast, the machine appears more focused on scientific concepts. Still, some articles appear on both, such as United_States. When looking at the connectivity of the Wikipedia article for United States, it reveals 1551 incoming and 294 outgoing links. This mean that the U.S. article is a great hub that can be easily accessible and lead to many useful links. The fact that it is less used than the Wikipedia article for “Animal” on the machine side seems surprising. However, this might reveal some implicit bias from the LLM towards the United_States article. It may not want to use that article as it might have been trained to avoid controversial notions and stay on more “neutral” concepts such as science and nature. This can explain why it prefers going through ‘Animal’ despite that article being 3 times less reacheable and leading to 10 times less articles than ‘United_States’. Nonetheless, the ‘United_States’ article is still a close second, which shows how useful and unavoidable this article is.
We further wanted to understand our machines capabilites by looking at how much humans vs the LLM tend to make the same choice when they are several times on the same article with the same goal to reach. For this, we studied the distribution of the entropy for every pair (goal, current_article) that was encountered, by humans or by LLMs.
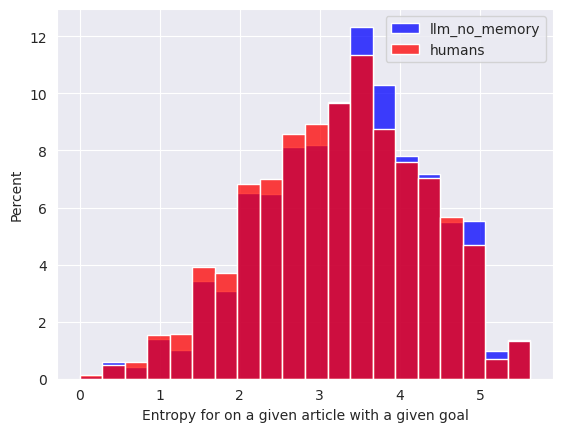
We see that when they are on a given article with a given goal in mind, the humans tend to make more predictable choices than the LLM. This is shown by the entropy of the probability distribution corresponding to which outgoing link is chosen from a given article with a given goal. This entropy tends to be lower for humans than for the LLM. The difference between the two distributions is significant above the 0.05 threshold using a Kolmogorov-Smirnov test. This tends to suggest that all the human players are together more consistent among themselves than the LLM is consistent with itself, despite the fact that humans on a given article with a given goal have the information of the previous articles they’ve already visited on this path, which could introduce variability in their choices, when the LLM only knows the current article, the start article and its goal when making its choice, which should tend to make it more deterministic. However, we observe the opposite. Either the LLM just makes more random choices in general, or knowing the starting goal from the prompt makes its choice differ even when the current and the goal article are the same.
Something you might have noticed is the smaller amount of data from our first model. Indeed, our initial basic protocol leads to a success rate of 55% with a significant number of paths left unexplored to completion, largely due to detected loops.
As a further step, we run our LLM with memory on this specific subset of unfinished paths, along with a sample of standard paths, to compare the performance of the memoryless LLM against the one with memory. In total, 13,411 paths are processed by our new system.
model: “gpt-4o-mini”
You are navigating Wikipedia from start_article to end_article.
Path taken so far: join(path_taken).
Currently at current_article.
Available links: join(linked_articles).
Which article would you like to visit next? Respond only with the article name.
As stated before, we begin by look at the lengths of the completed paths.
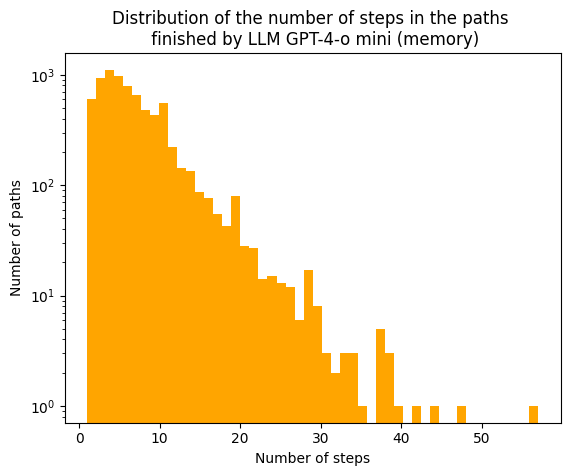 The median for the paths created by the LLM with memory is of 6 steps with a maximum of 57. Clearly, LLMs with memory tend to complete paths slower than without, showing that the machine is feeling around the articles and have difficulties finding a good suit.
As for the comparison with human, the llm with memory makes outliers paths, a good way to have a better understanding is to take both datasets up to the 99th percentile.
The median for the paths created by the LLM with memory is of 6 steps with a maximum of 57. Clearly, LLMs with memory tend to complete paths slower than without, showing that the machine is feeling around the articles and have difficulties finding a good suit.
As for the comparison with human, the llm with memory makes outliers paths, a good way to have a better understanding is to take both datasets up to the 99th percentile.
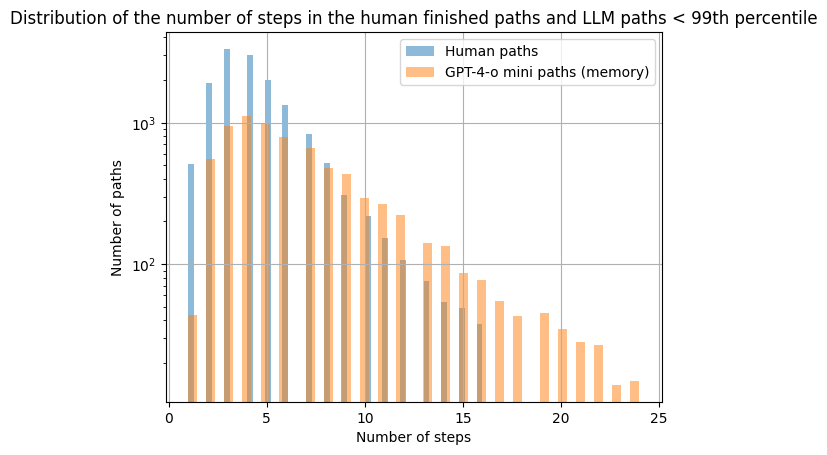
Over here, we can see more clearly how much both distributions are different. The LLM with memory paths are spreading more towards the right, i.e. they are more lengthier in general. This shows that our machine with memory is not able to get faster than humans.
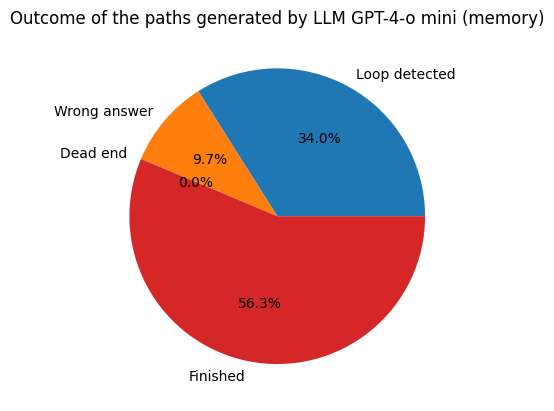
Even if the machine with memory is slower we can see that it improves on the success rate. We made the machine play on the paths unfinished by the LLM without memory and we saw that a success rate of 56,3%.
Side research: other models?
From the beginning we saw how GPT-4 plays Wikispeedia. How about other LLMs?
Did you here about MistralAI. It is an European leader in artificial intelligence. We chose this llm and made it follow the same protocol as our first one, without any memory. Let’s see how it does.
Using the Z-score, for a 95% confidence interval, the minimum number of paths needed to get a statistically significant result is 385. We added a bit more to add to the significance and therefore take randomly 565 rows from the dataset.
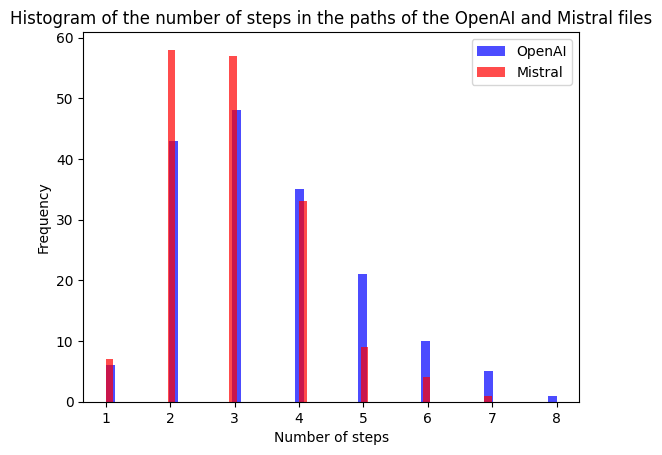 For the finished paths, we compared the number of steps taken and we can see that Mistral takes generally less steps to get to the target article, showing a better efficiency. Let’s look deeper into the comparison of success and failures for both models.
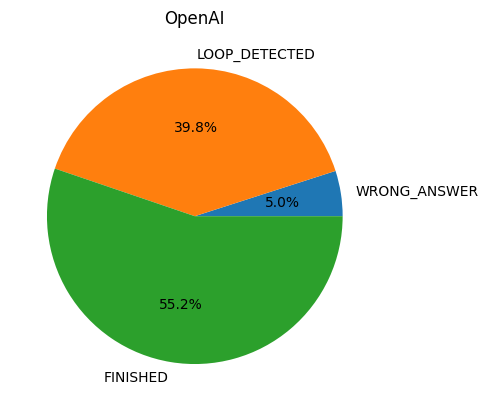
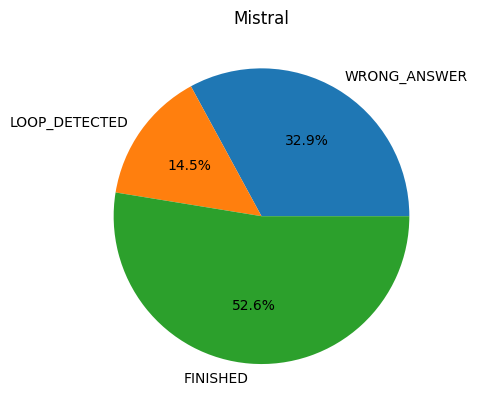
We can see that for both models the success rate is similar. However, OpenAI’s GPT-4 tends to loop more and MistralAI tends to give more wrong answers. This can show different digital minds, i.e. different abilities for a given task. From that we can speculate that MistralAI might have a bigger temperature, leading to more randomness in the answers and hence less predictable or correct results.
Shared strategies
Do LLMs exhibit the same strategy of “getting away” and then “homing in” as the paper shows humans do?
It was studied by Robert West, a notorious neural-data scientist from the previous century, that human players followed a pattern when playing the Wikispeedia game. The structure of human paths followed a two-fold structure:
- Getting out: Leaving the start article in search of a central “hub” from which players could reach many different target articles (e.g: United States).
- Homing in: The path from the chosen hub to the target article of the Wikispeedia game, getting more and more specific in the concepts crossed.
Going from the record of Wikispeedia games to the Wikispeedia measure of semantic relatedness requires caution: when in the getting out phase, players did not consider how the next article would allow them approach the target, but rather how they would allow them to reach the hub. Only the homing-in part of the path can then be considered to evaluate semantic relatedness between the articles of the path and the target article.
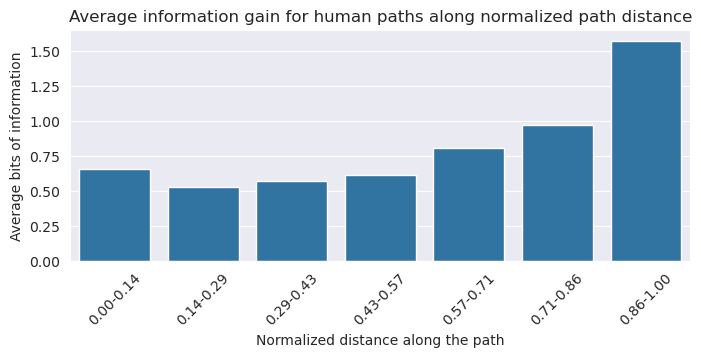
To formalize the analysis of this pattern, we use the concept of information gain. We explain it simply: The information gain corresponds to how much the randomness of the expected choices decreases going from one article to the next. The prime example of a high information gain is reaching an article where the link to the target article appears: From this article and with this link, the entropy is very low as players are incentivized to click on the target link. On the contrary, the information gain is at its lowest when the players reach the hub, which is often very far from the target article.
To separate the Getting Out and Homing in phases of the path, we use the lowest information gain point. This way, we compute the semantic distance only on the Homing in phase.
The evolution of the information gain throughout human paths is representative of the two-fold structure that we mentioned. We can see it as it is convex, with a phase of decreasing information gain as we reach the hub and an increasing information gain during the homing in phase.
Such a convex distribution of information gain for a varying path step can also be seen in the mean information gains for the LLM that does not use memory:
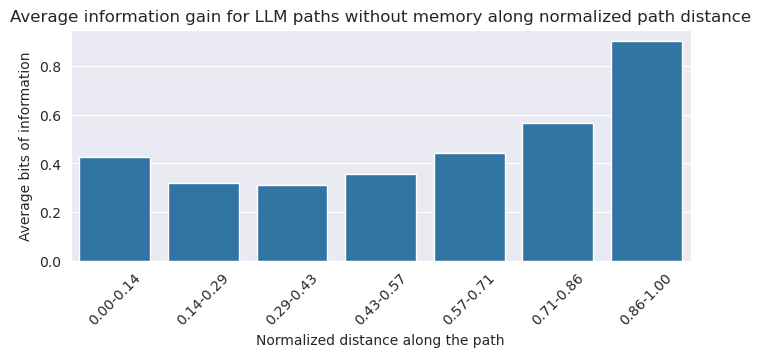
This similarity allows us to use the homing in phase to compute semantic distances according to the LLM without memory. But using the LLM with memory, we noticed that the convexity of the information gain distribution was for from clear, which convinced us that computing semantic distances for these paths based on the Wikispeedia method was not possible:
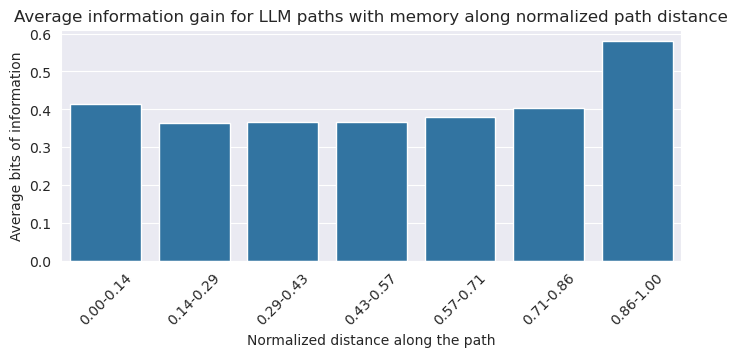
We cannot conclude that the LLM with memory has a getting out and homing in phase as there is no clear cutoff: our study shows that when given memory, an LLM plays Wikispeedia according to another strategy. First, it wanders around the graph, before doing a very short homing in phase. An example of this wandering phase can be seen in this path: War -> Wave. The LLM without memory finishes it quite clearly by going through the Energy hub. However, the LLM with memory goes through almost every century until reaching the end.
LLM Path: War → Weapon → Energy → Physics → Wave
LLM Memory Path: War → Ancient_Greece → Ancient_Rome → 1st_century_BC → Roman_Empire → 3rd_century → 4th_century → 5th_century → 6th_century → 7th_century → 8th_century → 9th_century → 10th_century → 11th_century → 12th_century → 13th_century → 14th_century → 15th_century → Renaissance → 16th_century → 17th_century → 18th_century → 19th_century → 20th_century → 21st_century → Tsunami → Wave
Thus, our analysis in the following parts only covers the LLM semantic distances when the LLM is given no memory.
A question of perspective
How do the distributions of computed semantic distance differ between human and machine?
Here, we aim to understand whether we obtain identical semantic distances or not, between our human and machine datas, and if not, try to see if we can find patterns:
- Which ones are longer? LLM-based or human-based? By how much? What is the distribution?
- Do the articles that have distances that differ the most belong to specific categories?
We wanted to see whether the games played by the LLMs would lead to different semantic distance measures. We computed the semantic distances between pairs of articles using both human game paths ad LLM game paths (without memory), using the same method as in the Wikispeedia paper. Then for all the pairs for which we had both an LLM distance and a human distance, we plotted the difference between the two distances.
We expected to have some differences, as the LLM played the game without memory, contrary to humans, potentially leading to different strategies, different concept associations and thus different semantic distances inferred.
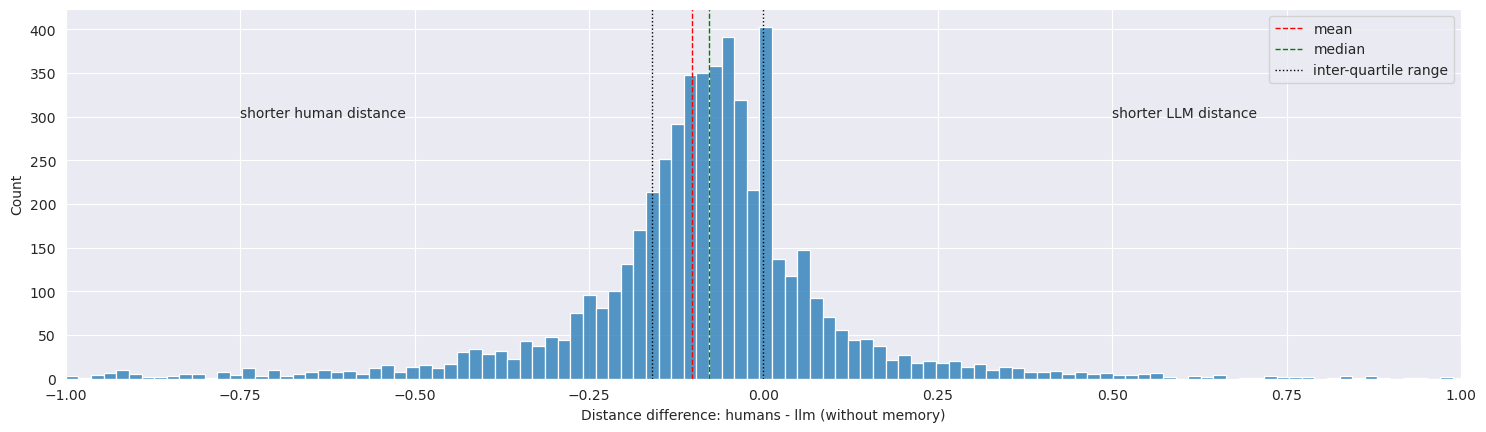
In general, the semantic distances computed from LLM paths (without memory) are longer: 0.40 on average and 0.35 in median for LLM, vs 0.38 on average and 0.32 in median for humans.
We found out that most article pairs had similar distances from humans and the LLM, with a mean and median distance difference of -0.02 and -0.03, respectively, and an big peak in our histogram around 0, meaning more than 1200 pairs have the same semantic distance for both humans and LLM. Thus, on average, the difference is only a small deviation from the average semantic distance, which is around 0.4 (both for LLM and humans). However, this small average difference hides the fact that there is actually quite some variance. Most distances distance differences are close to zero, but given that most distances are small, the differences are still significant in most cases. For example, 50% of the articles pairs that had both a human and an LLM semantic distance had an absolute difference in semantic distance of less than 0.12, but 0.12 represents more than 25% of the average distance. And this still leaves us with 50% of the pairs that have an even bigger distance difference between humans and LLM.
The plot of differences looks somewhat like a Gaussian distribution centered around 0, with a very small number of article pairs having very large distance differences (more than 0.5). However, the disproportionate peak at 0 breaks the normality of the data, and both the Anderson-Darling test, the D’Agostino’s K^2 test, and a QQ plot show that the distances do not formally follow a normal distribution. The Anderson-Darling test measures the goodness-of-fit by quantifying the distance between the observed cumulative distribution and the expected one, placing more weight on the tails. The D’Agostino’s K^2 test examines the skewness and kurtosis of the data, testing whether these deviate significantly from what would be expected under a normal distribution. Finally, the QQ plot graphically compares the quantiles of the observed data to a theoretical normal distribution, making deviations from normality visually apparent. This leads us to think it might more look like a Laplace distribution.
From this, we can conclude that while on average the behavior of the LLM seems to encode similar notions of semantic distances between concepts as humans, there is still some variance that makes the distances different in non-negligible ways for a significant amount of cases. This was to be expected given the protocol the LLM follows: playing without remembering the past steps of its path as it moves through the graph, leading to potentially less strategic and planned decisions involving conceptual relationships, and a bit more random wandering, amplified by the randomness inherent to the LLM.
Regarding the distances obtained using the LLM with memory, we consider that they are not comparable because the paths of the LLM with memory do not exhibit the same pattern of getting away to a hub and then homing in on the goal, thus not allowing us to filter out the potentially irrelevant distances by using the point of minimum information gain. Hence, we did not perform the same analysis of semantic distance difference between human and memory-based LLM semantic distances.
We decided to dig deeper in these big differences. We looked at the 10% of article pairs that had the biggest difference, and found articles of all categories and all types of pairs, thus not able to identify a predominant pattern in these pairs of articles.
The machine’s understanding of the human language
Do we observe the same difference between distances from human games and LLMs games, and between distances from human games and LLM embeddings?
Prior to our study, other methods already existed to compute the semantic distance between two words. Indeed, language models usually use a system of word embeddings, which is a specific representation of words and notions. An interesting point with these embeddings is that they can be visualized as high-dimensional vectors. They can hence be compared together with simpler comparison tools, such as the euclidean L2 distance. Previous studies show that the embeddings learned by models usually capture the semantic behind words. For example, as embeddings are vectors, we can add them up together. It turns out that the result of the operation ‘Greece’ - ‘Athens’ + ‘Paris’ yields a very similar vector to the one representing ‘France’. We are now interested in the similarities in distribution between the difference in distances computed on paths played by humans VS our machine, and the difference in distances computed on paths played by humans VS existing human embeddings.
We first used a Bidirectional Encoder Representations from Transformers (BERT) base model. This architecture has proven to be consistently powerful on multiple natural language processing tasks, specifically those related to semantic understanding. Hence, it seems like the perfect fit for our task.
To study the distribution of differences, we followed the following protocol:
-
Compute the distances for the paths played by humans and by our machine.
-
Compute the difference of distance for each path in common.
-
Extract the pair of articles.
-
Compute for each of the pairs the BERT embeddings of each article.
-
Based on the embeddings, compute the euclidean distance between two article names.
-
Compute the difference with the distances for the paths played by humans
For the distribution of difference between human computed and machine computed distances, we can see that the distribution of differences between human and LLM computed distances resembles a Laplace distribution, which clearly indicates a strong alignment between human and machine understanding of semantic relationships. Indeed, this is visible because the mean, median and interquartile range are all very close to 0. However, the distribution is still spreading a bit, suggesting that the machine may deviate a bit more from human understanding. Besides the obvious outliers previously described (English_language), the largest differences in absolute value suggest different priorities when computing the semantic difference. For example, the difference in the human distance for Canada and Japan and the machine distance shows that the machine potentially thinks more abstractly, i.e. these are two countries, hence the concepts are very similar. However, humans may give more importance to other specificities, such as the geographic distance, lack of common historical themes, etc…
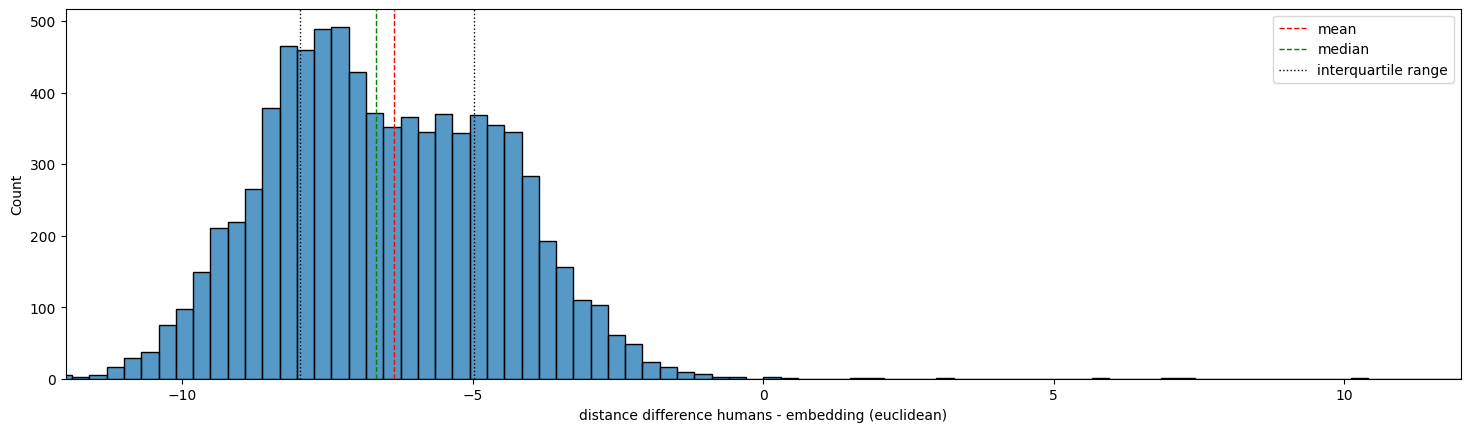
Now, looking at the distribution of the difference between human computed distances and embeddings, the data looks more Gaussian, with a mean and median around -6. This means that, distances computed by humans paths are usually way lower than the ones computed by humans, showing discrepancy in the understanding of the human language.
Therefore, we can overall conclude that our machine aligns more with humans in the distance computed based on the paths it plays, hence it mimics the human behavior as expected.
In summary
In the face of our world dealing with the aftermath of a crisis, understanding human cognition and behavior is paramount for rebuilding civilization. Our study, conducted here at the Applied Digital Anthropology department, delved into the intricacies of human thought by analyzing Wikispeedia gameplay. We observed that while LLMs can navigate the information space efficiently, their capabilities are still limited and the strategies employed often diverge from human approaches. Notably, LLMs without memory get stuck quickly in loops or give wrong answers. LLMs with memory, on the other hand, struggle to replicate the human tendency to “get away” and then “home in” on target concepts.
Further research is crucial to bridge this gap and develop AI systems that can effectively assist in the reconstruction and optimization of our post-apocalyptic society. By understanding the nuances of human cognition, we can leverage the power of AI to rebuild a more resilient and informed future.